Month 12
THE RACIAL WEALTH GAP AND FINANCIAL STABILITY

Month 12 Challenge
By 2015, the average income of the top 1% in Illinois was 27 times higher than the average income of the bottom 99% (the 8th highest rate in the country for this measure). The Chicago-Naperville-Elgin metropolitan area had the worst gap in the state, with the top 1% earning 27.8X more than all other earners (ranking 37th highest out all U.S. metropolitan areas). Illinois also has the 8th most regressive state and local tax system in the country: the poorest 20% pay 14.4% of their income on taxes, while the wealthiest 1% pay 7.4% of theirs. Regressive tax systems like Illinois’ contribute to and perpetuate income inequality.
The gap in wealth (savings and assets) is even greater. Unable to save, ALICE families do not have the means to build assets, let alone catch up to those who already have assets (especially those who have been building assets for generations). ALICE families also face more barriers that, when compounded, create an even bigger wealth gap. These include issues like lower pay for women, racial/ ethnic discrimination in homeownership, and student loan debt. According to the U.S. Federal Reserve, White households have a median net worth that is almost 10X higher than that of Black households. To create an economy that works for all of us, we need to understand and address the racial wealth gap.
Prosperity NOW notes only half of Americans realize that there is a wide gap in financial well-being between White households and households of color. Even among those who do recognize the racial economic inequality, there is a widespread misconception that the problem is only based on income. The problem is much deeper than that – when we consider wealth, the financial capital families need to expand their economic opportunity and agency, the disparity facing households of color grows even larger.
Please choose two or more of the below activities to complete:

ACTIVITY 1
Interested in seeing how the disparity developed over our nation’s history? Watch an episode of Netflix’s Explained, “The Racial Wealth Gap”. Reflect on what you watched and acknowledge any new information.
Select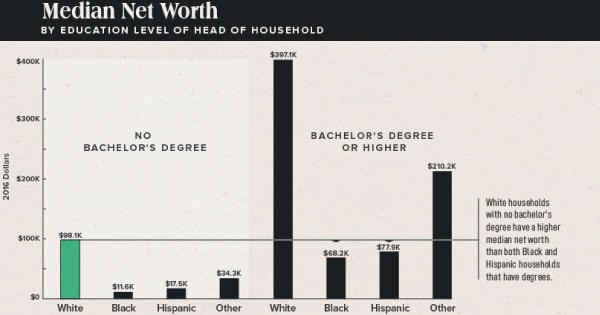

ACTIVITY 2
Take a look at Asset Types Held by Race, by Jenna Ross, Visual Capitalist. Reflect on the asset types held by the race you identify with and those of other race identity groups.
Select
ACTIVITY 3
See how your selected city or region is doing on several key equity indicators and how inequity threatens economic prosperity—National Equity Atlas. Reflect on how you see key indicators showing up in your community and the impact it has on your own economic prosperity. Consider how equitable economic prosperity benefits you. Consider the systemic interconnections; how equal distribution of wealth and power leads to greater sense of community, aligned community values, decrease in crime, increase in property values, desirable place to live, work, and grow, fewer gaps to fill, lower taxes, economic prosperity for all.
Select

ACTIVITY 4
Journal on you and your family’s experiences of work and money.
- What career do you have?
- What did your parents have?
- What was the source of their financial stability—earned income, inherited resources (e.g., a home passed down)?
- How did that affect your family’s earning power?